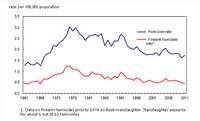
Homicide Rate in Canada (to 2011)
In this activity, we will be looking at 'real' crime statistics in Canada. To begin, use this link to Statistics Canada:
https://www.statcan.gc.ca/eng/start
Once on the page, click on the "Subjects" tab. On this new page, click on the "Crime and Justice" tab. On this page, under the heading 'Find data on' click on the "Crime and offences" tab. This brings you to a page where you will find updated statistics on various crime categories across Canada.
For instance, Table 1 is entitled "Court workload indicators, adult criminal courts, by caseload and age of cases." In total, there are 75 crime category tables. Rather than me choosing one of these crime categories and asking you to discuss the statistics, I would like you to pick ONE of the category tables to discuss in a journal.
*Spend a little time looking over some of the tables so that you can choose one that you would like to investigate.
ie. While Table 1 doesn't sound very interesting to me, Table 41 "Number, percentage and rate of gang-related homicide victims" appears to be a topic I would be more interested in investigating.
Assignment:
After choosing ONE category table, I would like you to write a journal where you explain and show your understanding of the data presented. Consider these ideas for discussion:
- what do the statistics show?
- what might explain these statistics?
- are there any trends?
- what do these trends suggest?
- do these statistics or trends surprise you? how?
- do these statistics represent the reality of this (specific) crime?
This journal should be at least one paragraph (9-12 sentences). The title to this journal should be the title of the category table, in case I need to look at the statistics myself.
As always, if there are any questions or concerns, please post them on this website by clicking on the "Comments" tab (as your question(s) may help others); otherwise, email me your journal at [email protected]
 RSS Feed
